Real-time dashboards for instant intelligence
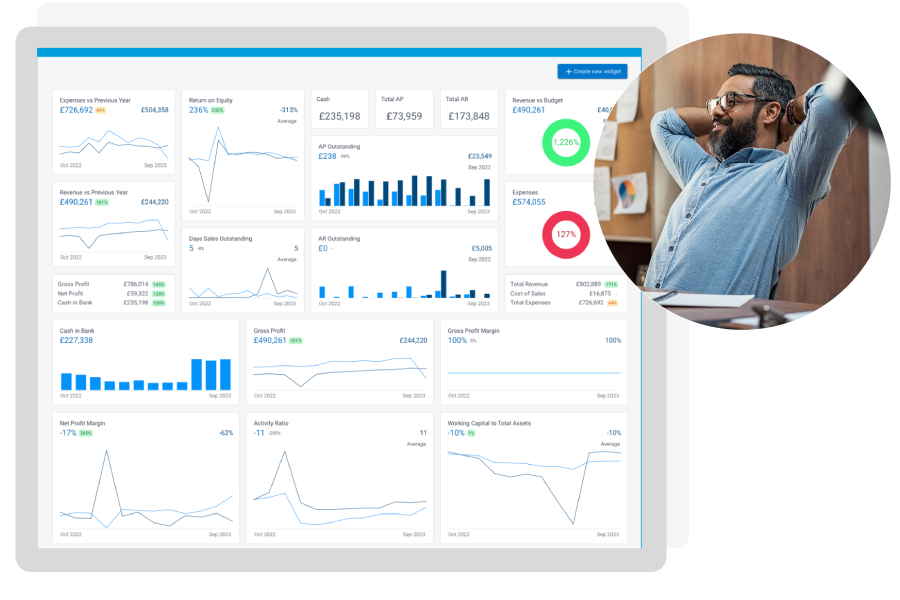
Our Joiin dashboard provides a highly visual one-page financial overview, allowing you to easily stay updated with the metrics that matter most.

“A dashboard that shows you precisely what you need to see, whenever or wherever you need to see it.”
Key finance metrics at a glance
Need to grasp that day’s highlights and make sense of your numbers? Let Joiin automatically create your dashboard with our simple yet powerful interface, or completely customise it to show precisely what you need to see, wherever you are on any device. Pictured below, data is presented visually in charts and graphs, providing an easy-on-the-eye way to monitor finances and stay up-to-the-minute regarding business performance.
All your metrics in one place
Our dashboard brings all your key metrics together in one place and is completely customisable to meet your group’s reporting requirements.
Combine multi-entity data to get a quick snapshot of group performance.
To customise, choose from several widget types, such as KPIs, chart types and filters.
Configure reporting widgets the way you want to see them.
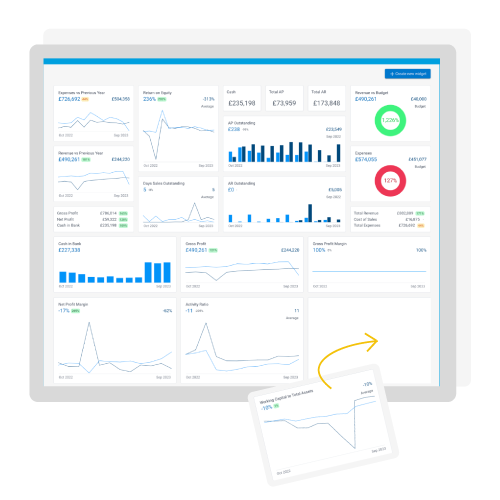
Drag and drop, move and re-size widgets to get your desired dashboard.
Get more insights by comparing to previous periods or budgets.
Use our automatically generated dashboard for convenience and speed.
FAQs regarding dashboard reporting
Can I share my Joiin Dashboard with other team members or stakeholders?
We believe in making collaboration as easy as possible by enabling you to share your Dashboard with team members or stakeholders in the office or on the go.
Simply select the sharing options within the Dashboard settings and invite others to view or collaborate on the financial insights, you can even choose how much access to allow, meaning you can be sure that everyone is on the same page.
How frequently is the information on the Joiin Dashboard updated?
The Joiin Dashboard provides real-time data updates at the touch of a button, so you can be sure that you have access to the most current financial information whenever you need it.
Can I track the performance of multiple entities simultaneously on the Joiin Dashboard?
Yes, you can. The Dashboard feature is designed to support multi-entity tracking.
Set up different widgets for each entity to monitor their performance side by side. This capability is particularly beneficial for businesses with diverse operations, offering a consolidated view of financial data in one central location.
How does the Joiin Dashboard improve my financial visibility and analysis?
Our newly upgraded Dashboard is a powerful tool for enhancing financial visibility and analysis, giving you a visual representation of key financial metrics and making it easier to identify trends, patterns, and areas that may require attention.
With customisable widgets, you can focus on specific aspects of your business, enabling data-driven decision-making in real-time.
Can Joiin help me generate consolidated financial reports for multiple entities or departments?
It’s what we do best! Whether you have multiple entities or departments, you can effortlessly combine financial data into consolidated reports. This allows you to streamline the reporting process and see a holistic view of your organisation’s financial health.
Start creating dashboards today
Looking for something specific?
Explore our Support area, or feel free to drop us a line


